Manual
The following guide will allow you to visualize protein/peptide data with Proteator. Begin with Uploading data in order to learn how to map peptides
to their respective positions on the protein. Tools and filters provides information for the different tools or filters to use.
For usage of Proteator, we recommend the web browser Google Chrome, although some other browsers will also work. Please note
that Proteator is still under development and will receive updates from time to time which will improve its functionality.
Uploading data
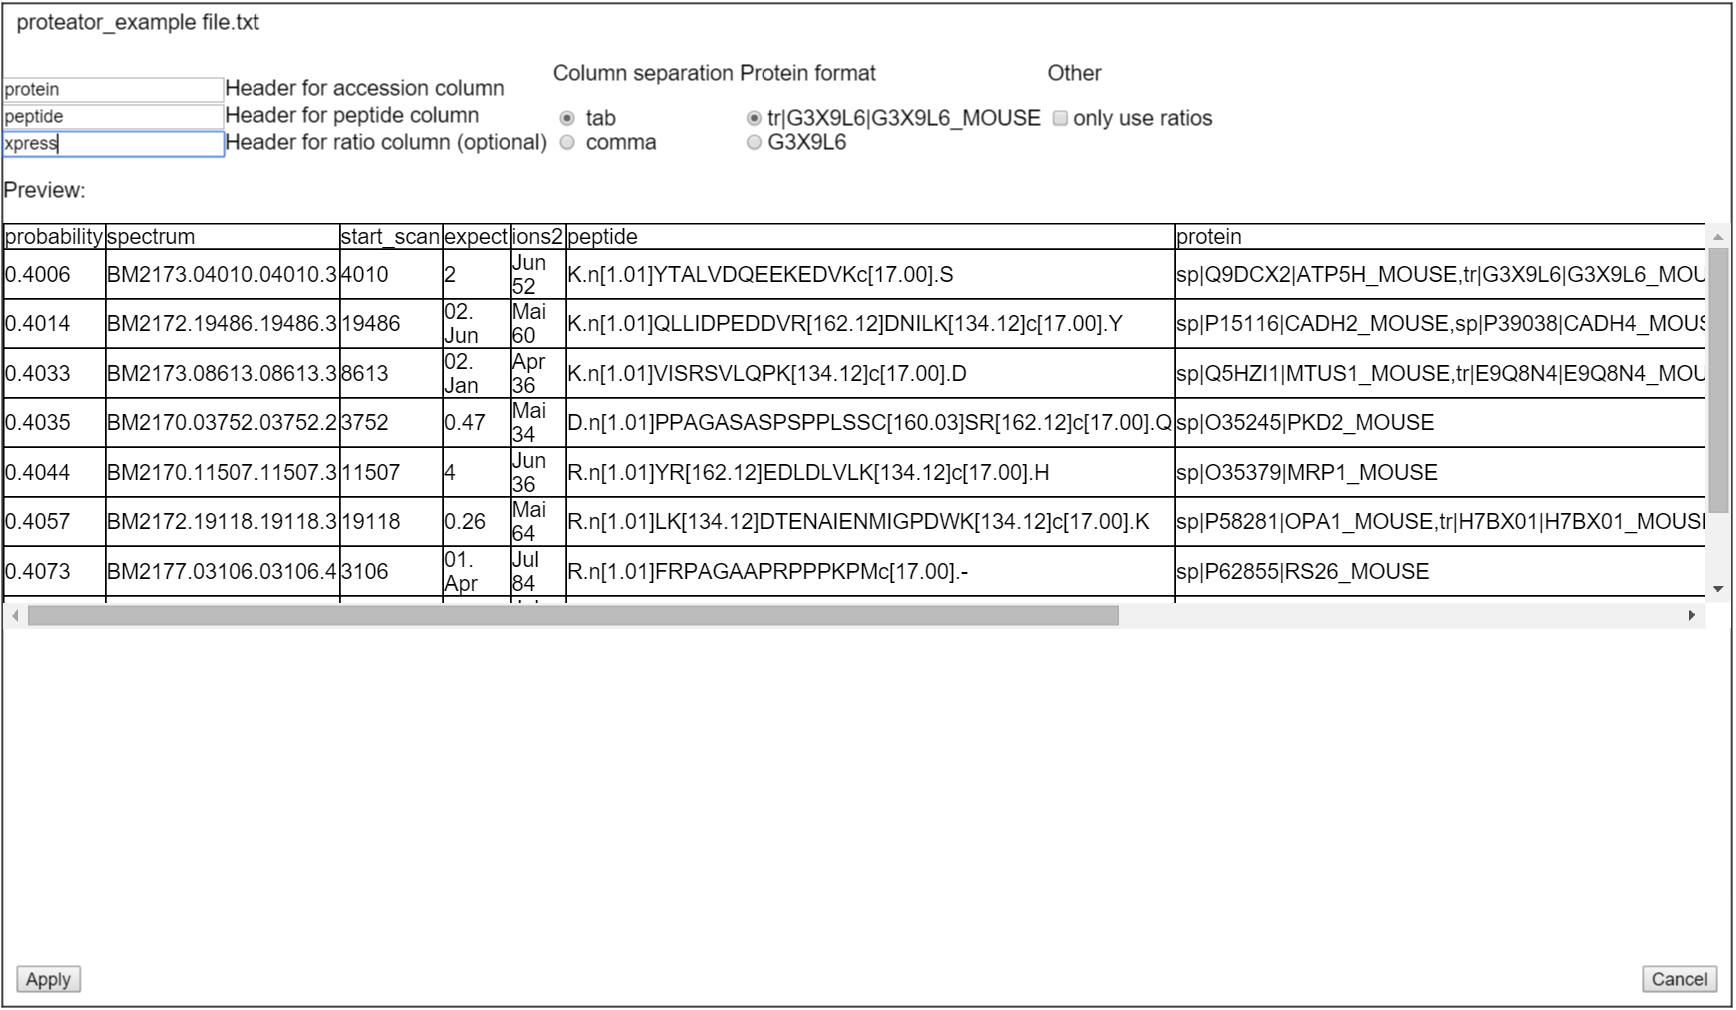
- Specify whether the file is comma or tab-separated under "Column separation".
- For "Header for accession column", enter the title of the column that contains the protein accession (in this example "protein"). The entries should be the Uniprot ID in one of the following formats: G3X9L6 or tr|G3X9L6|G3X9L6_MOUSE . Note that if several proteins, separated by commas are present, all of them will be regarded.
- For "Header for peptide column", enter the title of the column containing the peptide sequence (example: "peptide").
- If the file contains an express ratio, enter the respective colum title under "Header for ratio column" (example: "ratio"). The values should be supplied as ratio (values between 0 and →∞).
- Repeat those steps for all files which are displayed in the the upper left corner of the window.
- Click apply.

Tools and filters
Settings:
- Under "Tools" click on "Settings".
- As "Max. Color" select a color between 1 and 10. This color determines from which maximum value onwards mapped peptides will be tainted in the brightest color. Select smaller numbers to increase contrast between peptides with lower fold changes.
- To adjust settings in order to cope with color blindness, select new colors for the fold changes under "Fold change negative" and "Fold change positive". Peptides with a fold change of 0 are always displayed in grey.
- Under "Batch size", select the number of proteins downloaded at a time. While higher numbers will increase download speed if the internet connection is good, lower numbers are recommended for slow connections.
- Note: cookies need to be enabled in order to save settings.
Filters:
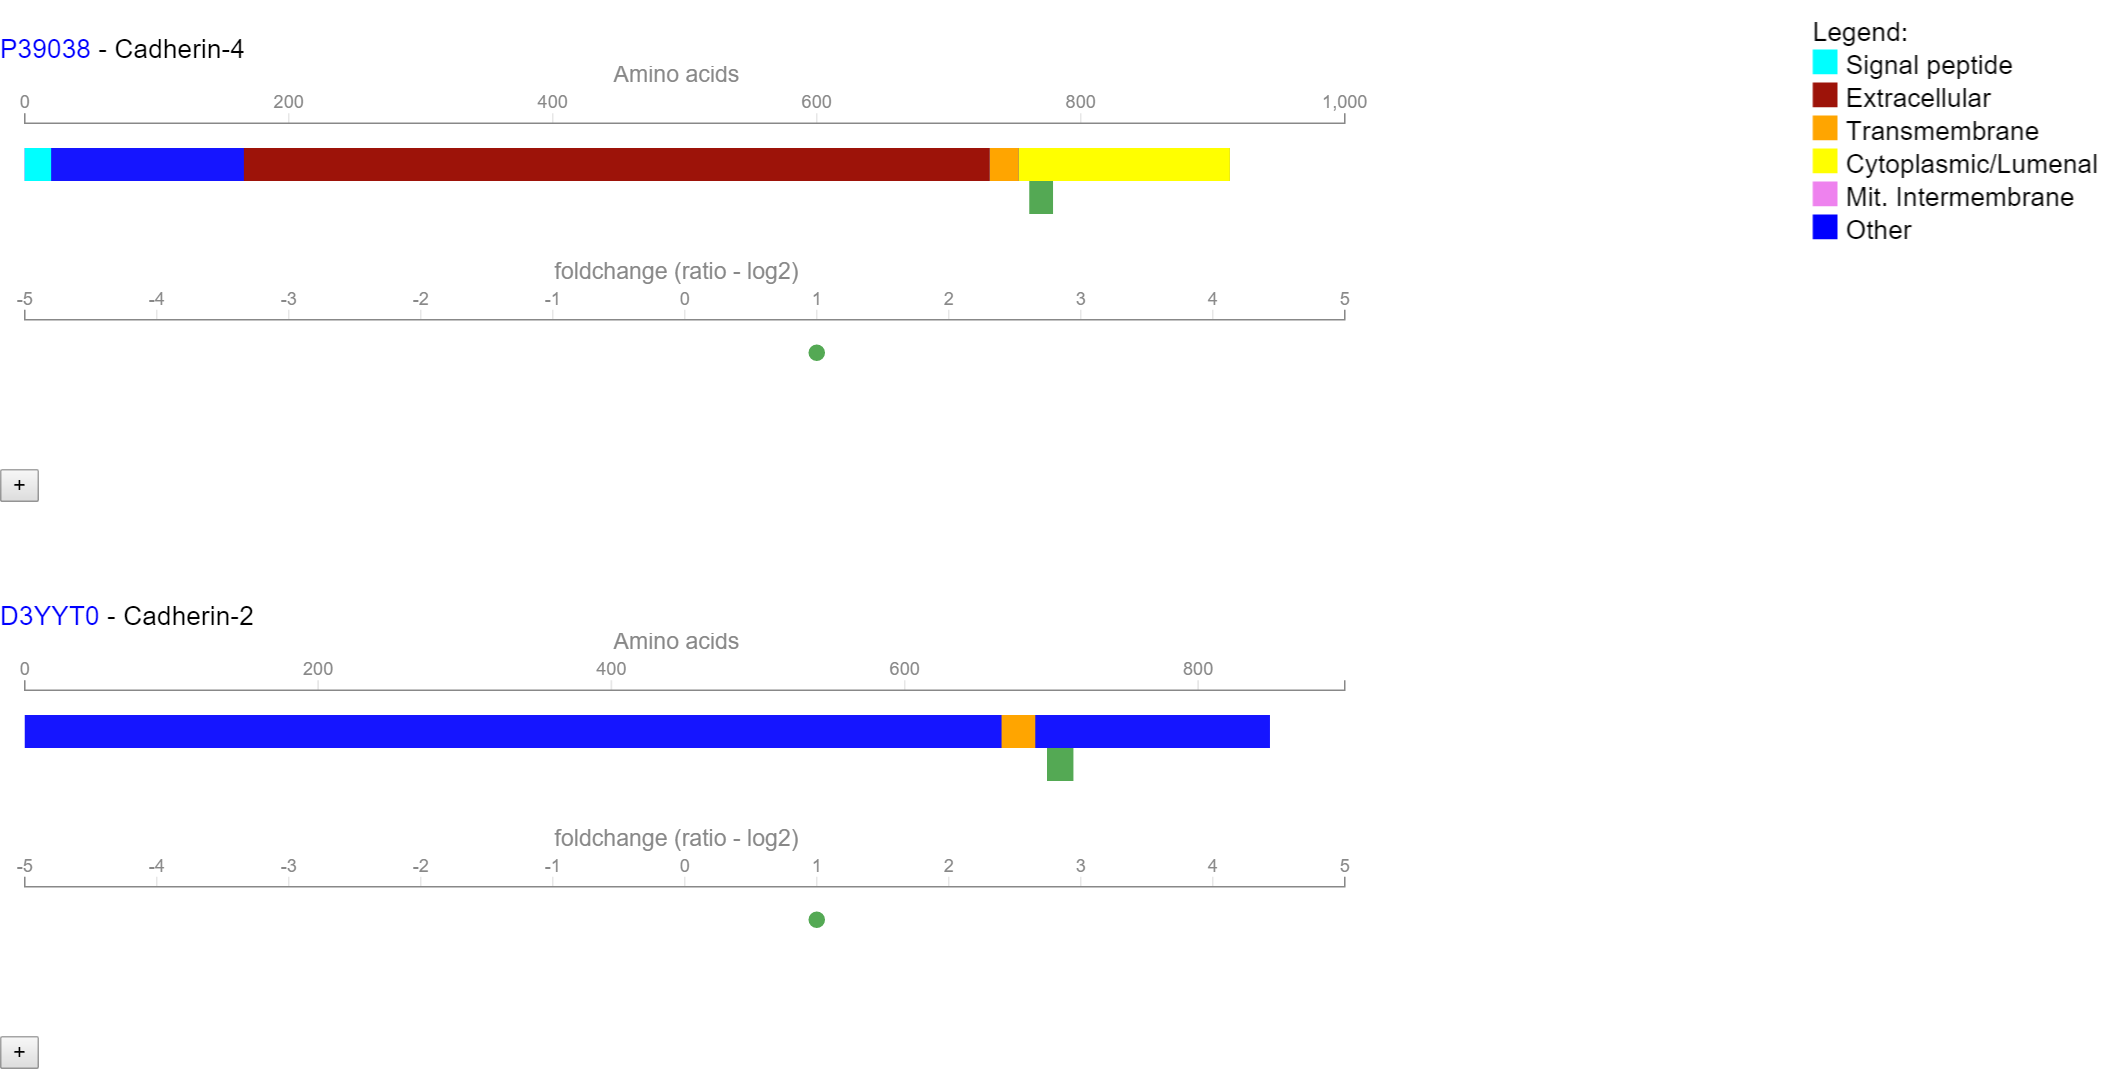
- After a dataset has been visualized, move your mouse to "Filter".
- At the current moment, you can filter for three types of topological domains: cytoplasmic/lumenal, transmembrane and extracellular.
- Select any of those three domains.
- Filter types determines which logic should be applied to the selected domains:
- Select "Display all" to undo filters and display everything.
- "AND" applies Boolean AND logic to the selected domains. If "AND" is selected, only proteins are shown which contain ALL of the selected domains.
- "OR" applies Boolean OR logic to the selected domains. If "OR" is selected, all proteins are shown which contain either of the selected domains.
Tools:
- Under "Tools" click "Invert foldchange" to invert all foldchange values.
- Toggle "I/L" nondifferentiation in order to remove differentiation between I and L in peptides when aligning. I and L will be displayed as "1" instead.
- A histogram can be created under "Create histogram"
- A log of the download process (including errors) can be retrieved under "Export Log"
- [CURRENTLY DEPRECATED] Click "Calculate coverage" to calculate and display the coverage for each protein.
Impressum
Proteator was created by Patrick Heisterkamp (contact: patrick.heisterkamp@gmail.com), University of Freiburg, for the AG Schilling, University of Freiburg.Especial gratitude goes to Lars Nilse and Björn Grüning (both University of Freiburg) who provided valuable support during the development.
The sequence viewer is used under Apache License 2.0. It was created by greenify and ljgarcia on biojs.io.
Publication:
Lars Nilsea, Dönem Avcib, Patrick Heisterkampa, Oliver Serangc, Marius K. Lembergb, Oliver Schilling
Yeast membrane proteomics using leucine metabolic labelling: Bioinformatic data processing and exemplary application to the ER-intramembrane protease Ypf1 BBA-Proteins Proteom., 10 (2016), pp. 1363-1371 Return to main page.